Filter the glacier length and area time series#
In this short tutorial, we show how to deal with unwanted “spikes” in the length and area time series of individual glaciers. These happen because OGGM currently doesn’t differentiate between snow and ice, i.e. occasional years with large snowfall can artificially increase the glacier area.
While the best solution would be to deal with this in OGGM, this is currently not possible because we do not have a generally applicable solution to this problem. In the meantime, we recommend a simple workaround.
Set-up#
import matplotlib.pyplot as plt
import xarray as xr
import os
from oggm import cfg, utils, workflow, tasks
cfg.initialize()
2024-04-25 13:15:05: oggm.cfg: Reading default parameters from the OGGM `params.cfg` configuration file.
2024-04-25 13:15:05: oggm.cfg: Multiprocessing switched OFF according to the parameter file.
2024-04-25 13:15:05: oggm.cfg: Multiprocessing: using all available processors (N=4)
cfg.PATHS['working_dir'] = utils.gettempdir(dirname='OGGM-Filter')
Define the glaciers for the run#
We take the Kesselwandferner in the Austrian Alps:
rgi_ids = ['RGI60-11.00787']
Glacier directories#
# in OGGM v1.6 you have to explicitly indicate the url from where you want to start from
# we will use here the elevation band flowlines which are much simpler than the centerlines
base_url = ('https://cluster.klima.uni-bremen.de/~oggm/gdirs/oggm_v1.6/'
            'L3-L5_files/2023.3/elev_bands/W5E5/')
gdirs = workflow.init_glacier_directories(rgi_ids, from_prepro_level=5, prepro_border=80,
                                         prepro_base_url=base_url)
2024-04-25 13:15:07: oggm.workflow: init_glacier_directories from prepro level 5 on 1 glaciers.
2024-04-25 13:15:07: oggm.workflow: Execute entity tasks [gdir_from_prepro] on 1 glaciers
2024-04-25 13:15:07: oggm.utils: Downloading https://cluster.klima.uni-bremen.de/~oggm/gdirs/oggm_v1.6/L3-L5_files/2023.3/elev_bands/W5E5/RGI62/b_080/L5/RGI60-11/RGI60-11.00.tar to /github/home/OGGM/download_cache/cluster.klima.uni-bremen.de/~oggm/gdirs/oggm_v1.6/L3-L5_files/2023.3/elev_bands/W5E5/RGI62/b_080/L5/RGI60-11/RGI60-11.00.tar...
Run#
We can step directly to a new experiment! This runs under a random climate representative for the recent climate (1985-2015) and a warm temperature bias:
workflow.execute_entity_task(tasks.run_random_climate, gdirs,
                             nyears=200, y0=2000, seed=5,
                             output_filesuffix='_commitment');
2024-04-25 13:15:11: oggm.workflow: Execute entity tasks [run_random_climate] on 1 glaciers
2024-04-25 13:15:11: oggm.core.flowline: (RGI60-11.00787) run_random_climate_commitment
2024-04-25 13:15:11: oggm.core.flowline: (RGI60-11.00787) flowline_model_run_commitment
The problem#
ds = utils.compile_run_output(gdirs, input_filesuffix='_commitment')
ds = ds.isel(rgi_id=0)  # take just the one glacier
2024-04-25 13:15:12: oggm.utils: Applying global task compile_run_output on 1 glaciers
2024-04-25 13:15:12: oggm.utils: Applying compile_run_output on 1 gdirs.
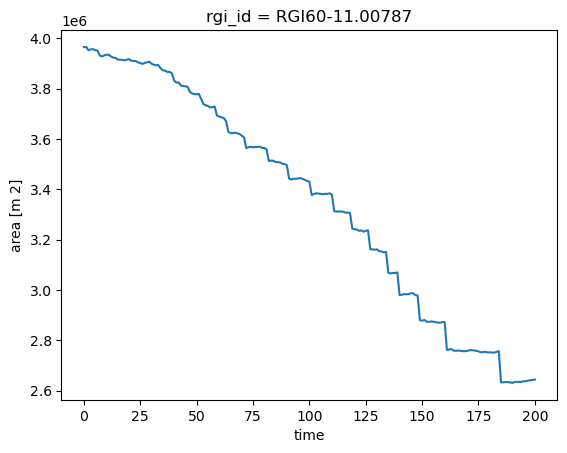
ds.area.plot();
ds.length.plot();
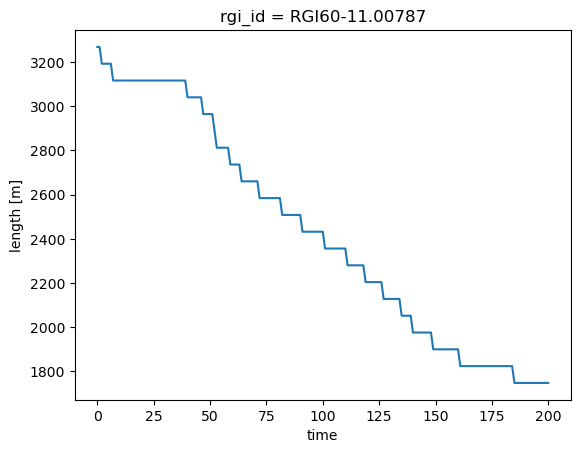
For small areas, the glacier has the unrealistic “spikes” described above.
Workaround#
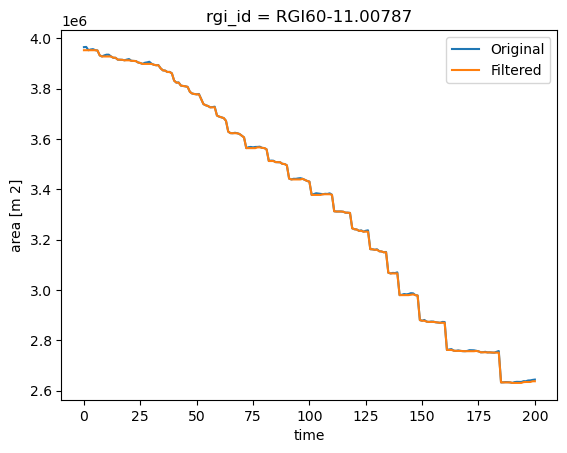
A good way to deal with the issue is to run a moving filter which keeps the smallest area or length in a given window size:
roll_yrs = 5
# Take the minimum out of 5 years
ts = ds.area.to_series()
ts = ts.rolling(roll_yrs).min()
ts.iloc[0:roll_yrs] = ts.iloc[roll_yrs]
# Plot
ds.area.plot(label='Original');
ts.plot(label='Filtered');
plt.legend();
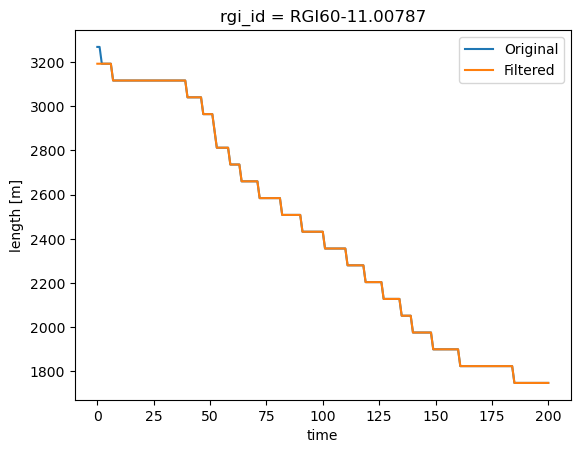
It works the same with length:
# Take the minimum out of 5 years
ts = ds.length.to_series()
ts = ts.rolling(roll_yrs).min()
ts.iloc[0:roll_yrs] = ts.iloc[roll_yrs]
# Plot
ds.length.plot(label='Original');
ts.plot(label='Filtered');
plt.legend();
What’s next?#
return to the OGGM documentation
back to the table of contents