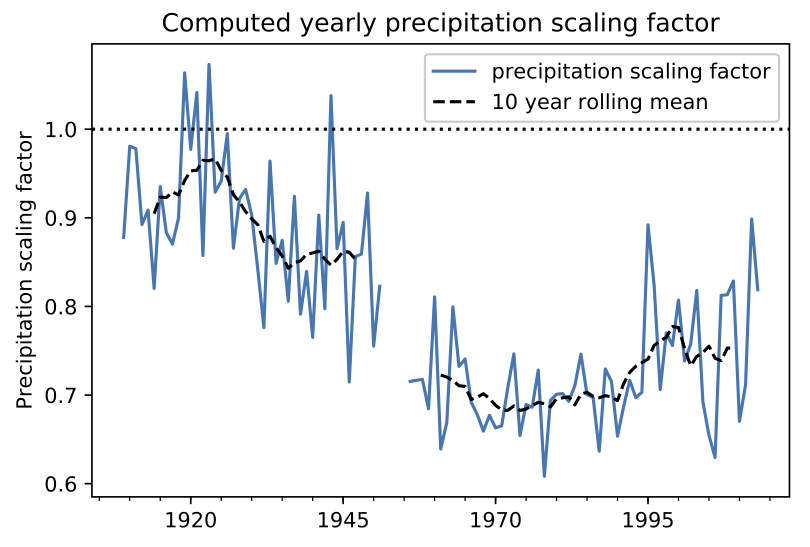
All glacier models must be calibrated and validated in order to give meaningful results. For the computation of the mass-balance, we use historic climate data: in the alpine region, HistAlp in the best candidate. However, one important tuning parameter of the OGGM is the so called precipitation scaling factor. This factor scales the precipitation amount given by the gridded climate data: in general, this factor is greater than one to take elevation effect into account.
Hereafter I’ll compare the precipitation and temperature records from the HistAlp dataset with nearby station data, in order to better constrain this factor for the glacier I am working on (Upper Grindelwald). This includes the somewhat difficult data acquisition and preprocessing, general findings and difficulties as well as more quantitative results and their implications on the following calibration phase.
Data acquisition
A it turns out, working with real station data is… hard, to say the least. Especially if the data comes from different sources, with different temporal resolution, little to no meta data… well, I’ll just consider it as a learning experience.
HistAlp data
The dataset contains monthly precipitation sum records and monthly mean temperature records at a reference location (46°34’ N, 8°05’ E) and for the corresponding reference altitude of 2011 m asl. The temperature gradient is assumed to be constant at -6.5 °C per km (i.e. moist adiabatic lapse rate). Data is available between October 1801 and September 2014.
Station data
Station data comes from the online data archive of MeteoSwiss ground level monitoring networks IDAWEB. All stations considered lie within an (arbitrary chosen) area of 60 km width and 40 km centered around the Upper Grindelwald Glacier and above an altitude of 2’000 m asl.
Precipitation
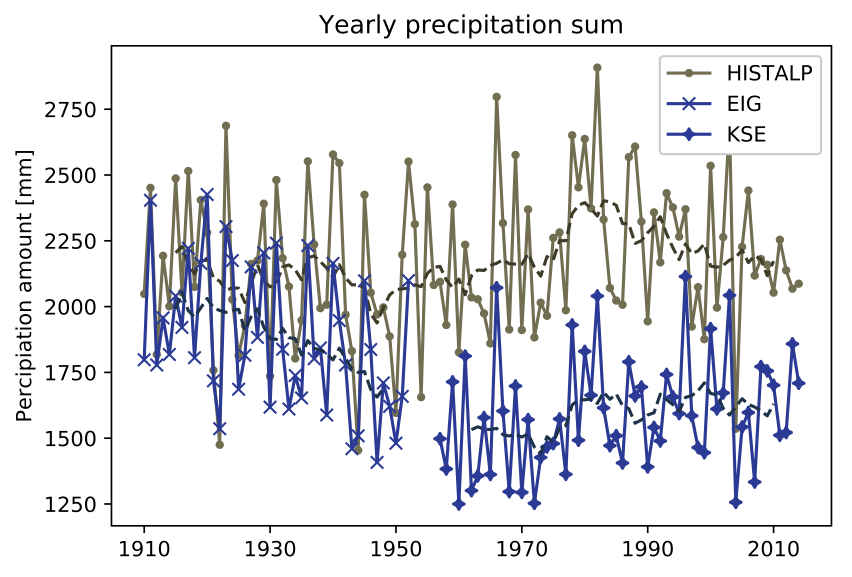
The stations Eigergletscher (EIG) and Kleine Scheidegg (KSE) provide monthly precipitation sum records from November 1908 until April 1952 and from May 1955 up to present, respectively. This gives an (almost) continuous record worth 1’235 months of data, available for comparison with the HistAlp data set (up to September 2014). The two stations are less than 1.5 km apart and located at an altitude of 2320 m and 2060 m asl., respectively.
- Eigergletscher (7°58’/46°35’), 2320 m asl., data from 1908 until 1952
- Kleine Schneidegg (7°58’/46°35’), 2060 m asl., data since 1960
In addition, there are six more stations with over 10 years of precipitation records (operated by the SLF, therefore called SLF stations in the following) . These stations provide daily precipitation sums (6UTC to 6UTC on the following day). The data is somewhat messy, which makes the preprocessing (computing monthly sums, dealing with missing data, outlier correction) non trivial. In addition, the overall information gain is quite limited.
- SLFFIR: Grindelwald / First (8°04’/46°40’), 2110 m asl., data from 2000 until 2018
- SLFGAD: Gadmen / Gschletteregg (8°24’/46°45’), 2060 m asl., data from 2000 until 2018
- SLFGO3: Goms / Treichbode (8°14’/46°29’), 2430 m asl., data from 2004 until 2018
- SLFGU2: Guttannen / Homad (8°17’/46°41’), 2110 m asl., data from 2000 until 2018
- SLFSH2: Schilthorn / Türliboden (7°50’/46°35’), 2360 m asl., data from 2000 until 2018
- SLFUR2: Urseren / Giltnasen (8°31’/46°35’), 2170 m asl., data from 1998 until 2018
Temperature
The station Junfraujoch (JUN) provides monthly (and daily) mean air temperature records since 1933. It is located within 12 km from the Upper Grindelwald Glacier, but is significantly higher than the other stations at 3580 m asl.
- JUN: Junfraujoch (7°59’/46°33’), 3580 m asl., data from 1933 until 2018
Methods
Outlier correction: some stations had obvious outliers (e.g. 863 mm in 24 hours). These were corrected manually.
Computation of monthly and yearly precipitation sums: The HistAlp dataset comes with monthly temporal resolution, which is why all the other data must be brought into the same format. Besides, for the time scales we are working on, a monthly (or even yearly) temporal resolution is sufficient. Furthermore, daily records tend to be too noisy for correlation analysis.
This leaves me with the task/problem of calculating monthly (and yearly) sums of the precipitation records of the SLF stations. Not too big of a deal, but some data is missing. If it’s just a single day per month that is missing, it can be neglected (i.e. assumed to be zero). Month with no records at all are treated as missing. But how to deal with month were multiple days show no records?! A threshold number of days must be defined, below which a monthly sum has no meaning…
In order to not just take a completely random number, I probably went a bit overkill… First I computed the number of missing days per month for every station, excluding months with no records at all. After fitting a gamma distribution, I computed the maximum number of missing days for certain lower tail probabilities. Based on that I decided to skip month with more than 7 missing days. By doing so I end up with 77% to 94% of all available month being used, depending on the station.
Correlation of cyclic data: Monthly (and daily) precipitation and temperature data have an inherent periodicity on longer time scales. A similar seasonal cycle is seen in the data of any station, resulting in an overestimated correlation. The key is to look at anomalies rather than absolute values. Therefore an average value for each month over the entire period is estimated. The anomaly is given by the difference (positive or negative) to the months average value.
Results
Long term precipitation:
The HistAlp data shows generally higher monthly (and yearly) precipitation sum than the station data.
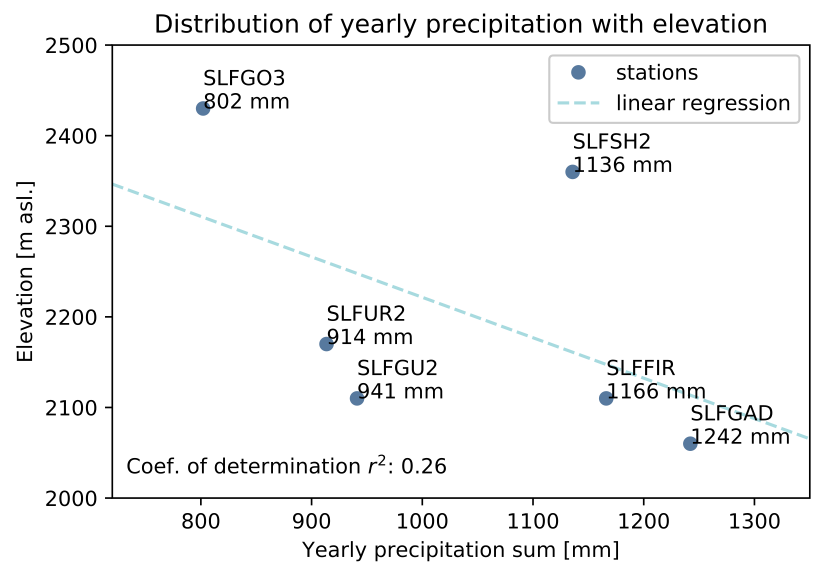
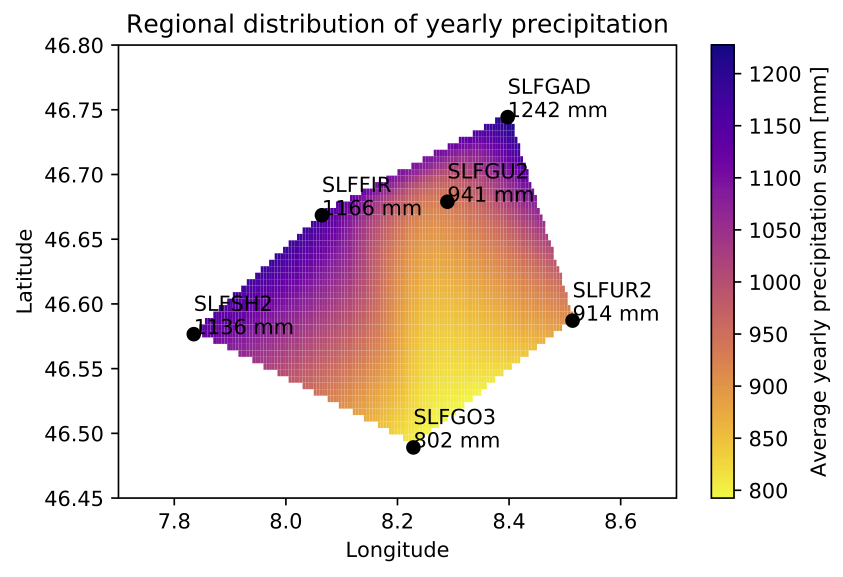
Regional precipitation distribution (SLF stations): The SLF stations allow the investigation of the precipitation distribution with height and location, even if only for the last 10ish years. Since it are only six stations, the validity of the findings is questionable.
A decrease of precipitation with elevation is possible, even if it is a quite bold statement with a coefficient of determination well below 0.3. In addition, precipitation seems to be higher on the northwesterly slope of Bernese Alps and lower on the southeasterly slope. I would say that the average yearly precipitation sum depends on both, the geographical location and elevation, most probably in an non linear way.
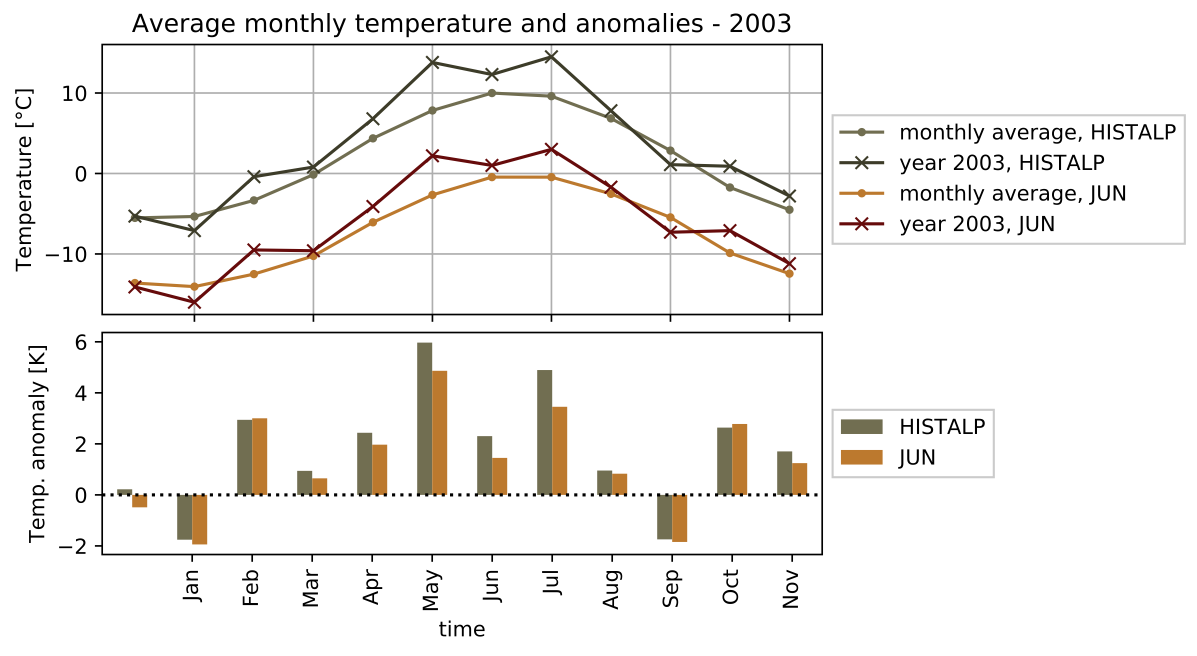
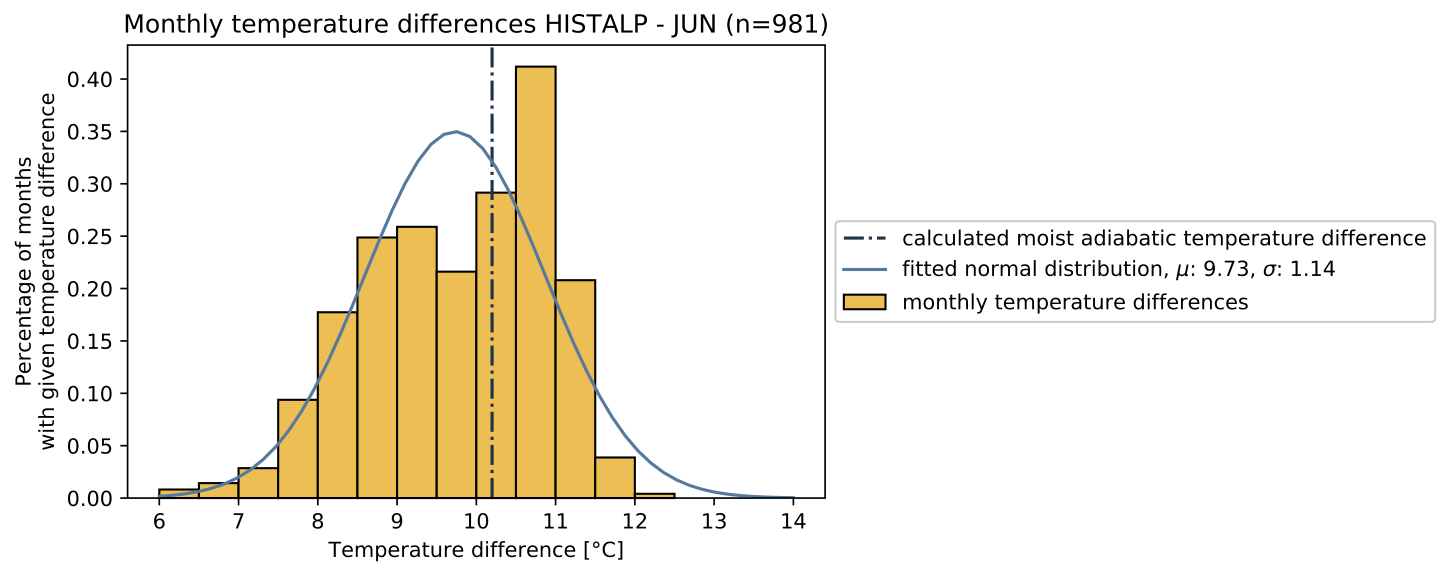
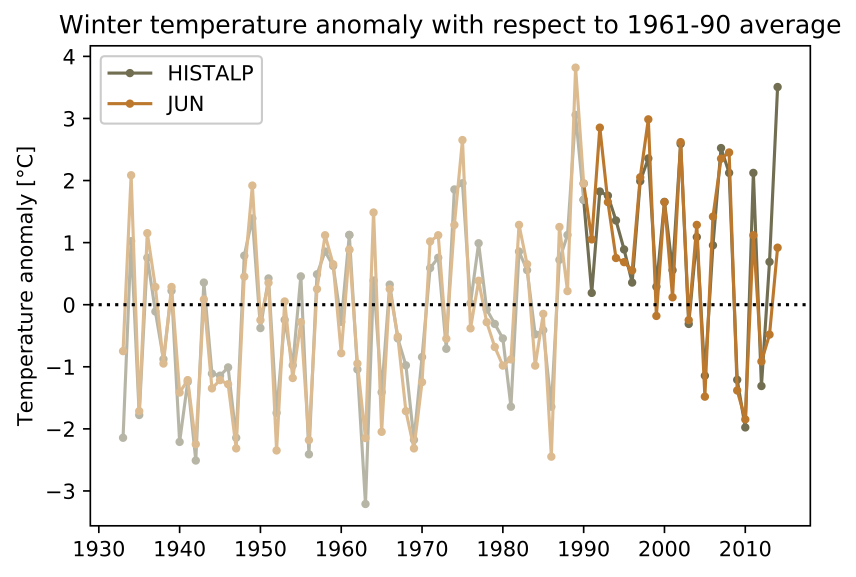
Temperature: The monthly mean temperature records of the Jungfraujoch station correlate to over 92% with the HistAlp data. It is more than likely that the HistAlp data set is directly linked to the Jungfraujoch records, explaining the strong correlation. The difference in absolute values between the station and the HistAlp data ranges between 6°C and 12.5°C. The Jungfraujoch station is located at 3580 m asl., whereas the HistAlp is referenced at 2011 m asl., resulting in an elevation difference of roughly 1570 m. Using the dry adiabatic lapse rate of 6.5 K/km this yields a temperature drop of a little over 10°C, matching the calculated differences.
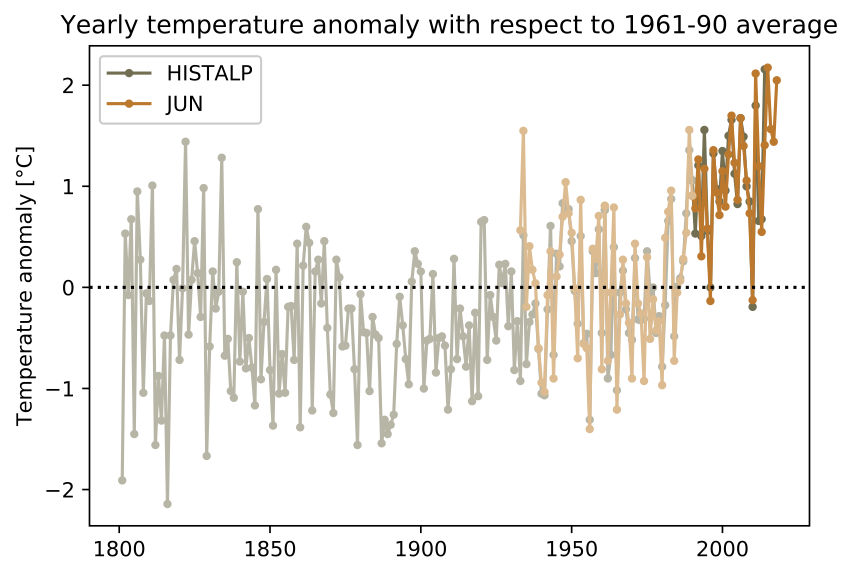
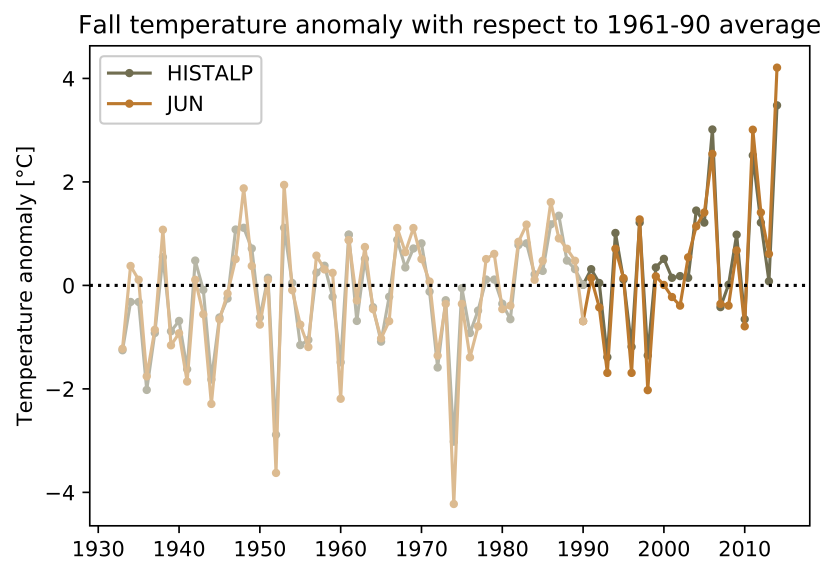
Trend in yearly average temperature: A common way to investigate temperature trends is to look at the anomalies in yearly temperature average with respect to the average over the climatological reference period between 1961 and 1990. There is a positive trend after 1990, as to be expected. The trend is most prominent in spring months, followed by summer and fall. The winter months show a slight negative trend if anything at all… The summer of 2003 shows exceptionally high values, with an anomaly of +4.5°C and +3.9°C for the HistAlp and Jungfraujoch data, respectively.


Discussion
OGGM parameter estimation: The global OGGM default precipitation scaling factor is 2.5, while the best value for the HistAlp domain is 1.75 (Dusch 2018).
The precipitation amount in the HistAlp data set is generally higher than the measured station value. Computing the precipitation scaling factor based yearly precipitation sums gives values between 1.7 and 0.6, with an average of 0.8. But there are certain arguments that speak for a higher value:
- Rain gauges are generally prone to undercatch Pollock et. al., 2014
- The Upper Grindelwald Glacier is a cirque glacier. The accumulation area is surrounded by high peaks, which is likely to increase the precipitation amount.
- Avalanches from the adjacent steep slopes is an additional mass gain.
- The precipitation amount used by the model must not necessarily be equal to the actually fallen precipitation. Not all natural processes are resolved in the model, which is why the input parameter must/can be tuned in order to get the best validation result.
Considering all this informations the Alps/HistAlp default value of 1.75 seems like a good starting point for the following calibration/validation phase. We will consider lowering it to 1 as well.