Data used by OGGM#
In this notebook, we want to showcase what OGGM does best: preparing data for your modelling workflow.
We use preprocessed directories which contain most data available from the OGGM shop to illustrate how these could be used to inform data-based workflows.
Preprocessed directories with additional products#
We are going to use the South Glacier example taken from the ITMIX experiment. It is a small (5.6 km2) glacier in Alaska.
## Libs
import matplotlib.pyplot as plt
import numpy as np
import pandas as pd
import xarray as xr
import salem

# OGGM
import oggm.cfg as cfg
from oggm import utils, workflow, tasks, graphics
# Initialize OGGM and set up the default run parameters
cfg.initialize(logging_level='WARNING')
cfg.PARAMS['use_multiprocessing'] = False
# Local working directory (where OGGM will write its output)
cfg.PATHS['working_dir'] = utils.gettempdir('OGGM_Toy_Thickness_Model')
# We use the directories with the shop data in it: "W5E5_w_data"
base_url = 'https://cluster.klima.uni-bremen.de/~oggm/gdirs/oggm_v1.6/L3-L5_files/2023.1/elev_bands/W5E5_w_data/'
gdirs = workflow.init_glacier_directories(['RGI60-14.05446'], from_prepro_level=3, prepro_base_url=base_url, prepro_border=10)
2023-03-23 08:17:43: oggm.cfg: Reading default parameters from the OGGM `params.cfg` configuration file.
2023-03-23 08:17:43: oggm.cfg: Multiprocessing switched OFF according to the parameter file.
2023-03-23 08:17:43: oggm.cfg: Multiprocessing: using all available processors (N=8)
2023-03-23 08:17:43: oggm.workflow: init_glacier_directories from prepro level 3 on 1 glaciers.
2023-03-23 08:17:43: oggm.workflow: Execute entity tasks [gdir_from_prepro] on 1 glaciers
# Pick our glacier
gdir = gdirs[0]
gdir
<oggm.GlacierDirectory>
  RGI id: RGI60-14.05446
  Region: 14: South Asia West
  Subregion: 14-02: Karakoram
  Name: Hassanabad Glacier I
  Glacier type: Glacier
  Terminus type: Land-terminating
  Status: Glacier or ice cap
  Area: 45.712 km2
  Lon, Lat: (74.619, 36.4371)
  Grid (nx, ny): (134, 174)
  Grid (dx, dy): (105.0, -105.0)
OGGM-Shop datasets#
We are using the glacier directories processed especially to store more data than the default ones. In particular, they already store the data currently available in the OGGM shop:
with xr.open_dataset(gdir.get_filepath('gridded_data')) as ds:
    ds = ds.load()
# List all variables
ds
<xarray.Dataset>
Dimensions:                  (x: 134, y: 174)
Coordinates:
  * x                        (x) float32 -6.279e+03 -6.174e+03 ... 7.686e+03
  * y                        (y) float32 4.039e+06 4.039e+06 ... 4.021e+06
Data variables: (12/14)
    topo                     (y, x) float32 6.794e+03 6.829e+03 ... 3.782e+03
    topo_smoothed            (y, x) float32 6.74e+03 6.758e+03 ... 3.79e+03
    topo_valid_mask          (y, x) int8 1 1 1 1 1 1 1 1 1 ... 1 1 1 1 1 1 1 1 1
    glacier_mask             (y, x) int8 0 0 0 0 0 0 0 0 0 ... 0 0 0 0 0 0 0 0 0
    glacier_ext              (y, x) int8 0 0 0 0 0 0 0 0 0 ... 0 0 0 0 0 0 0 0 0
    consensus_ice_thickness  (y, x) float32 nan nan nan nan ... nan nan nan nan
    ...                       ...
    itslive_v                (y, x) float32 0.6974 1.081 1.712 ... 0.1377 0.1104
    millan_ice_thickness     (y, x) float32 8.761 24.3 30.38 ... nan nan nan
    millan_v                 (y, x) float32 0.4738 0.436 0.5834 ... 0.0 0.0 0.0
    millan_vx                (y, x) float32 -0.02371 0.3467 0.3173 ... nan nan
    millan_vy                (y, x) float32 0.4496 -0.1837 -0.3457 ... nan nan
    hugonnet_dhdt            (y, x) float32 nan 10.43 ... 0.007979 0.006662
Attributes:
    author:         OGGM
    author_info:    Open Global Glacier Model
    pyproj_srs:     +proj=tmerc +lat_0=0 +lon_0=74.619 +k=0.9996 +x_0=0 +y_0=...
    max_h_dem:      7539.0
    min_h_dem:      2409.0
    max_h_glacier:  7445.0
min_h_glacier: 2476.0That’s already quite a lot! We have access to a bunch of data for this glacier, lets have a look. We prepare the map first:
import salem
import matplotlib.pyplot as plt
smap = ds.salem.get_map(countries=False)
smap.set_shapefile(gdir.read_shapefile('outlines'))
smap.set_topography(ds.topo.data);
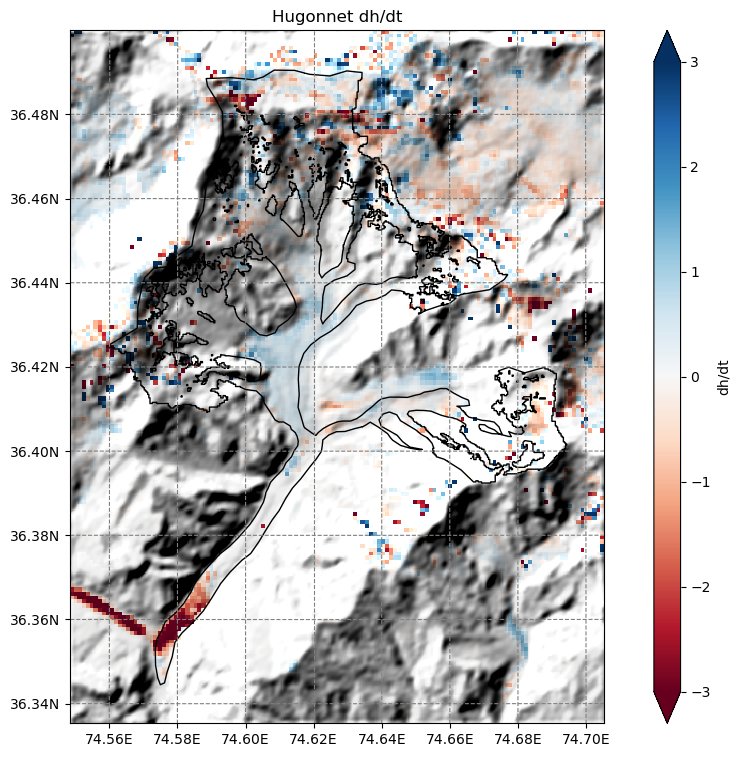
Hugonnet dh/dt data#
# get the axes ready
f, ax = plt.subplots(figsize=(9, 9))
smap.set_data(ds.hugonnet_dhdt)
smap.set_cmap('RdBu')
smap.set_plot_params(vmin=-3, vmax=3)
smap.plot(ax=ax)
smap.append_colorbar(ax=ax, label='dh/dt')
ax.set_title('Hugonnet dh/dt');
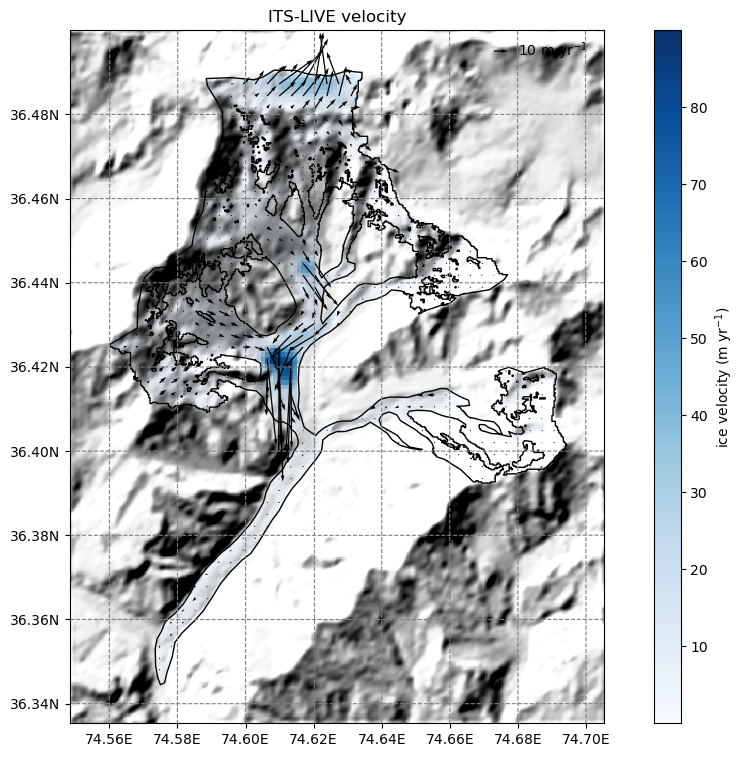
ITSLive velocity data#
# get the velocity data
u = ds.itslive_vx.where(ds.glacier_mask)
v = ds.itslive_vy.where(ds.glacier_mask)
ws = ds.itslive_v.where(ds.glacier_mask)
The .where(ds.glacier_mask) command will remove the data outside of the glacier outline.
# get the axes ready
f, ax = plt.subplots(figsize=(9, 9))
# Quiver only every N grid point
us = u[1::3, 1::3]
vs = v[1::3, 1::3]
smap.set_data(ws)
smap.set_cmap('Blues')
smap.set_plot_params()
smap.plot(ax=ax)
smap.append_colorbar(ax=ax, label='ice velocity (m yr$^{-1}$)')
# transform their coordinates to the map reference system and plot the arrows
xx, yy = smap.grid.transform(us.x.values, us.y.values, crs=gdir.grid.proj)
xx, yy = np.meshgrid(xx, yy)
qu = ax.quiver(xx, yy, us.values, vs.values)
qk = ax.quiverkey(qu, 0.82, 0.97, 10, '10 m yr$^{-1}$',
labelpos='E', coordinates='axes')
ax.set_title('ITS-LIVE velocity');
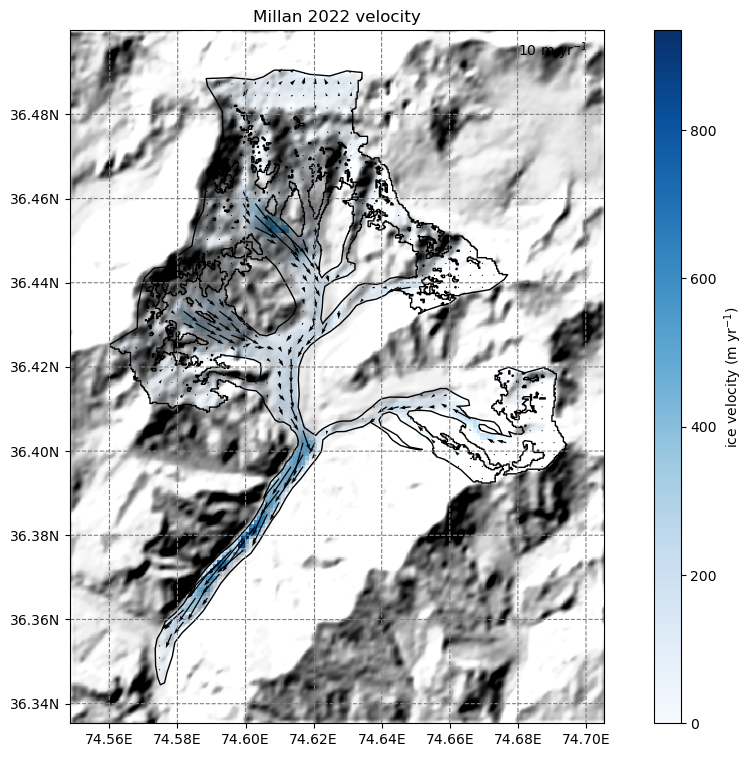
Millan 2022 velocity data#
# get the velocity data
u = ds.millan_vx.where(ds.glacier_mask)
v = ds.millan_vy.where(ds.glacier_mask)
ws = ds.millan_v.where(ds.glacier_mask)
# get the axes ready
f, ax = plt.subplots(figsize=(9, 9))
# Quiver only every N grid point
us = u[1::3, 1::3]
vs = v[1::3, 1::3]
smap.set_data(ws)
smap.set_cmap('Blues')
smap.plot(ax=ax)
smap.append_colorbar(ax=ax, label='ice velocity (m yr$^{-1}$)')
# transform their coordinates to the map reference system and plot the arrows
xx, yy = smap.grid.transform(us.x.values, us.y.values, crs=gdir.grid.proj)
xx, yy = np.meshgrid(xx, yy)
qu = ax.quiver(xx, yy, us.values, vs.values)
qk = ax.quiverkey(qu, 0.82, 0.97, 10, '10 m yr$^{-1}$',
labelpos='E', coordinates='axes')
ax.set_title('Millan 2022 velocity');
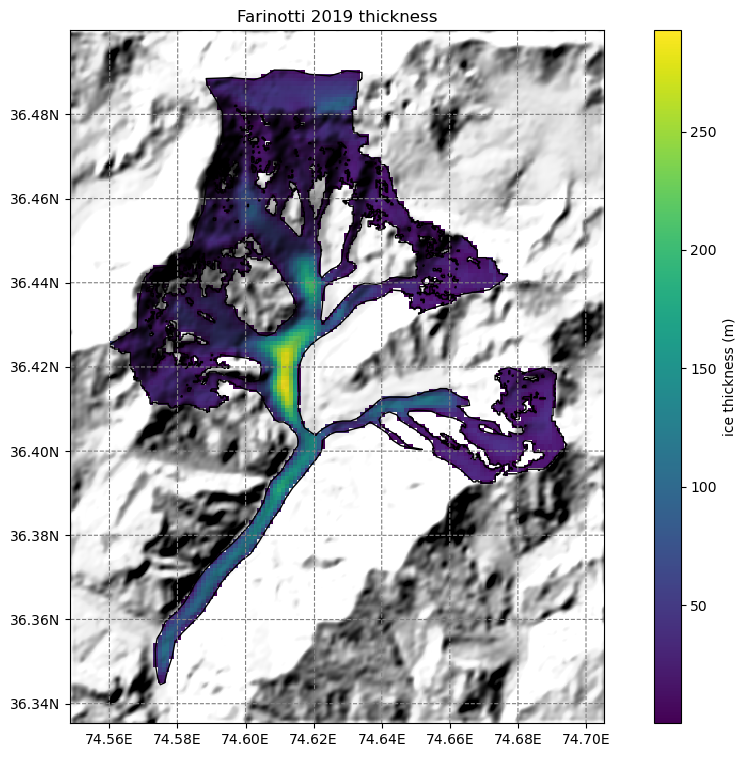
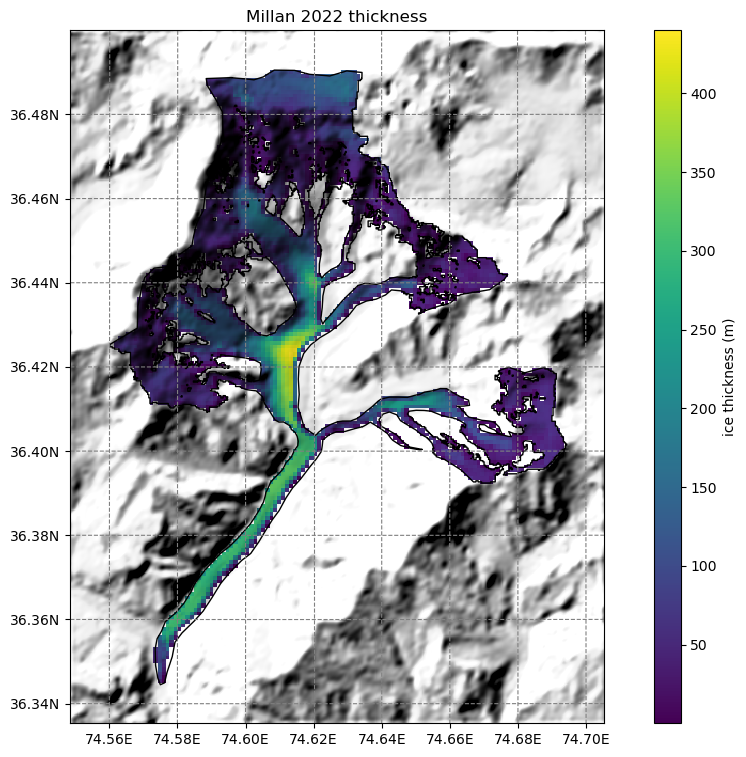
Thickness data from Farinotti 2019 and Millan 2022#
# get the axes ready
f, ax = plt.subplots(figsize=(9, 9))
smap.set_cmap('viridis')
smap.set_data(ds.consensus_ice_thickness)
smap.plot(ax=ax)
smap.append_colorbar(ax=ax, label='ice thickness (m)')
ax.set_title('Farinotti 2019 thickness');
# get the axes ready
f, ax = plt.subplots(figsize=(9, 9))
smap.set_cmap('viridis')
smap.set_data(ds.millan_ice_thickness.where(ds.glacier_mask))
smap.plot(ax=ax)
smap.append_colorbar(ax=ax, label='ice thickness (m)')
ax.set_title('Millan 2022 thickness');
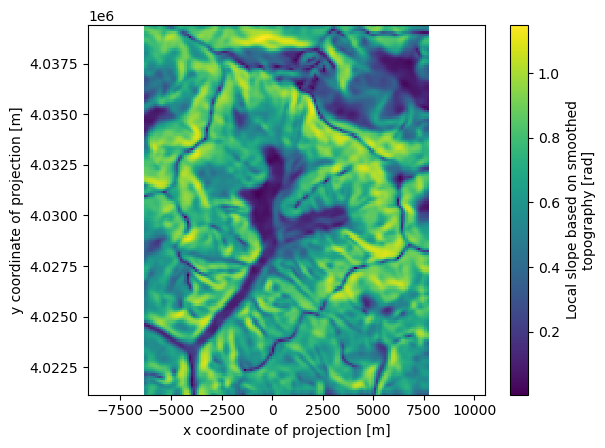
Some additional gridded attributes#
Let’s also add some attributes that OGGM can compute for us:
# Tested tasks
task_list = [
tasks.gridded_attributes,
tasks.gridded_mb_attributes,
]
for task in task_list:
workflow.execute_entity_task(task, gdirs)
2023-03-23 08:17:50: oggm.workflow: Execute entity tasks [gridded_attributes] on 1 glaciers
2023-03-23 08:17:50: oggm.workflow: Execute entity tasks [gridded_mb_attributes] on 1 glaciers
Let’s open the gridded data file again with xarray:
with xr.open_dataset(gdir.get_filepath('gridded_data')) as ds:
ds = ds.load()
# List all variables
ds
<xarray.Dataset>
Dimensions: (x: 134, y: 174)
Coordinates:
* x (x) float32 -6.279e+03 -6.174e+03 ... 7.686e+03
* y (y) float32 4.039e+06 4.039e+06 ... 4.021e+06
Data variables: (12/23)
topo (y, x) float32 6.794e+03 6.829e+03 ... 3.782e+03
topo_smoothed (y, x) float32 6.74e+03 6.758e+03 ... 3.79e+03
topo_valid_mask (y, x) int8 1 1 1 1 1 1 1 1 1 ... 1 1 1 1 1 1 1 1 1
glacier_mask (y, x) int8 0 0 0 0 0 0 0 0 0 ... 0 0 0 0 0 0 0 0 0
glacier_ext (y, x) int8 0 0 0 0 0 0 0 0 0 ... 0 0 0 0 0 0 0 0 0
consensus_ice_thickness (y, x) float32 nan nan nan nan ... nan nan nan nan
... ...
aspect (y, x) float32 3.332 3.375 3.478 ... 3.638 3.608
slope_factor (y, x) float32 1.186 1.195 1.237 ... 1.823 1.84
dis_from_border (y, x) float32 4.79e+03 4.696e+03 ... 7.029e+03
catchment_area (y, x) float32 nan nan nan nan ... nan nan nan nan
lin_mb_above_z (y, x) float32 nan nan nan nan ... nan nan nan nan
oggm_mb_above_z (y, x) float32 nan nan nan nan ... nan nan nan nan
Attributes:
author: OGGM
author_info: Open Global Glacier Model
pyproj_srs: +proj=tmerc +lat_0=0 +lon_0=74.619 +k=0.9996 +x_0=0 +y_0=...
max_h_dem: 7539.0
min_h_dem: 2409.0
max_h_glacier: 7445.0
min_h_glacier: 2476.0The file contains several new variables with their description. For example:
ds.oggm_mb_above_z
<xarray.DataArray 'oggm_mb_above_z' (y: 174, x: 134)>
array([[nan, nan, nan, ..., nan, nan, nan],
       [nan, nan, nan, ..., nan, nan, nan],
       [nan, nan, nan, ..., nan, nan, nan],
       ...,
       [nan, nan, nan, ..., nan, nan, nan],
       [nan, nan, nan, ..., nan, nan, nan],
       [nan, nan, nan, ..., nan, nan, nan]], dtype=float32)
Coordinates:
* x (x) float32 -6.279e+03 -6.174e+03 ... 7.581e+03 7.686e+03
* y (y) float32 4.039e+06 4.039e+06 4.039e+06 ... 4.021e+06 4.021e+06
Attributes:
units: kg/year
long_name: MB above point from OGGM MB model, without catchments
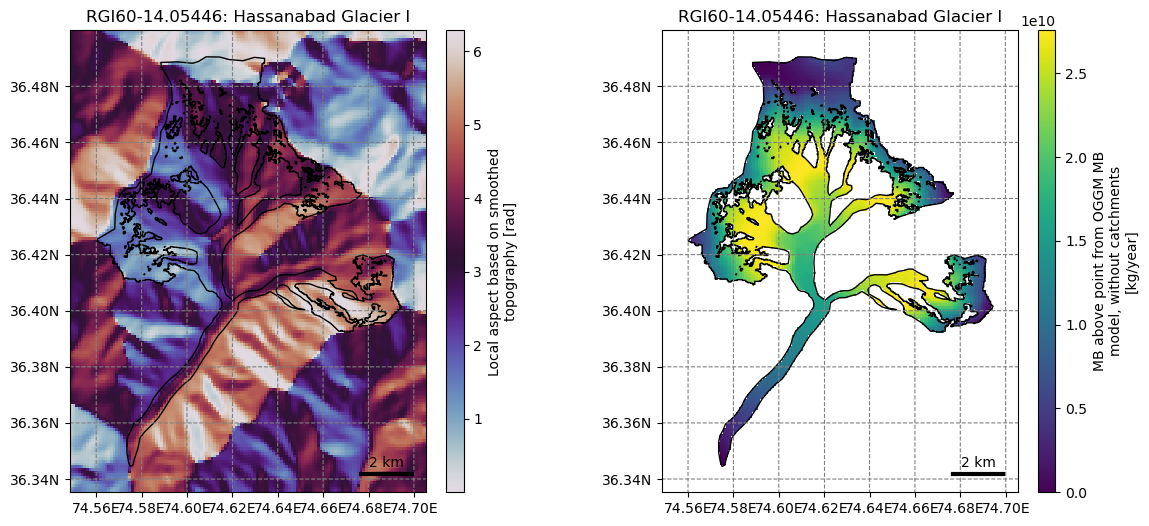
description: Mass balance cumulated above the altitude of thepoint, henc...Let’s plot a few of them (we show how to plot them with xarray and with oggm:
ds.slope.plot();
plt.axis('equal');
f, (ax1, ax2) = plt.subplots(1, 2, figsize=(14, 6))
graphics.plot_raster(gdir, var_name='aspect', cmap='twilight', ax=ax1)
graphics.plot_raster(gdir, var_name='oggm_mb_above_z', ax=ax2)