OGGM provides preprocessed glacier directories (“gdirs”), i.e. ready-to-use datasets containing all input data and standard preprocessing steps computed consistently. With version 1.6.3 (to be released in March 2026), OGGM provides a new set of preprocessed directories. These are either updates of the v1.6.1 ones, or new directories using updated climate data (ERA5) and RGI version 7 glacier outlines.
This blog post summarizes the available preprocessing options and their effects on failing glaciers and volume projections.
In a nutshell:
OGGM v1.6.1 and v1.6.3 produce nearly identical projections. Baseline climate (W5E5 vs ERA5) has little global impact but causes persistent regional differences, notably in New Zealand (region 18). Regional calibration lowers projected volumes in Central Asia (13). Updating from Randolph Glacier Inventory (RGI) 6.2 to RGI 7.0 reduces failing glacier area in North Asia (10) and the Caucasus and Middle East (12), which causes around 15% larger glacier volumes in year 2000 in these regions. Globally, 2000 volumes between RGI inventories are similar, but around ~15% smaller in the Low Latitudes (16) and New Zealand (18). Projection differences until 2100 using RGI7.0 instead of RGI6.2 are affected by the initial volume and regional spinup calibration. Overall, OGGM version and preprocessing option projection differences are smaller than differences to GloGEM or PyGEM, and smaller than differences between climate model forcing options.
Available options
OGGM v1.6.1 standard projections: 2023.3, W5E5, RGI62, per_glacier_spinup(gdir link):- the previous OGGM standard projections using OGGM v1.6.1, with W5E5 as baseline climate, RGI62 as glacier inventory, and dynamical spinup and calibration performed individually for each glacier
OGGM v1.6.3 standard projections: 2025.6, W5E5, RGI62, per_glacier_spinup(gdir link):- the same as above, but using OGGM v1.6.3 with the 2025.6 preprocessed glacier directory (differences between versions described in the OGGM version history)
2025.6, ERA5, RGI62, per_glacier_spinup(gdir link):- same as the OGGM v1.6.3 standard projections, but using ERA5 instead of W5E5 as baseline climate for the calibration. Note that ERA5 has a higher spatial resolution (0.25° × 0.25° grid) than W5E5 (0.5°). Both datasets were bias-corrected during the same time period (Jan 2000 – Dec 2019).
2025.6, W5E5, RGI62, regional_spinup(gdir link):- same as the OGGM v1.6.3 standard projections, but every glacier was calibrated to match the regional specific mass balance instead of the individual glacier-specific mass balance (similar as in Zekollari et al. (2024)). This experiment has been develloped mostly as comparison baseline for RGI7 (see below).
2025.6, W5E5, RGI70G, regional_spinup(gdir link):- same as above, but using the RGI70G inventory instead of RGI62. Differences between RGI versions are described in the RGI documentation. Like above, the calibration is done based on the regional MB values from Hugonnet et al., and precipitation correction factor and temperature bias values are chosen the same way as for the default experiment (but with the regional MB values as reference).
2025.6, W5E5, RGI70C, regional_spinup(gdir link):- same as above, but using the glacier complex product (RGI70C; more details here), which results in fewer “glaciers” in total instead of individual glaciers.
Both versions of the OGGM standard projections are available (as regionally or globally aggregated datasets, or as per-glacier files) at https://github.com/OGGM/oggm-standard-projections-csv-files for all climate models and scenarios available from the cluster. For the other four options, we tested projections for a single climate model and several scenarios. All notebooks and data used for this blog post are in this OGGM cluster folder. Further details in the OGGM documentation.
Error analysis
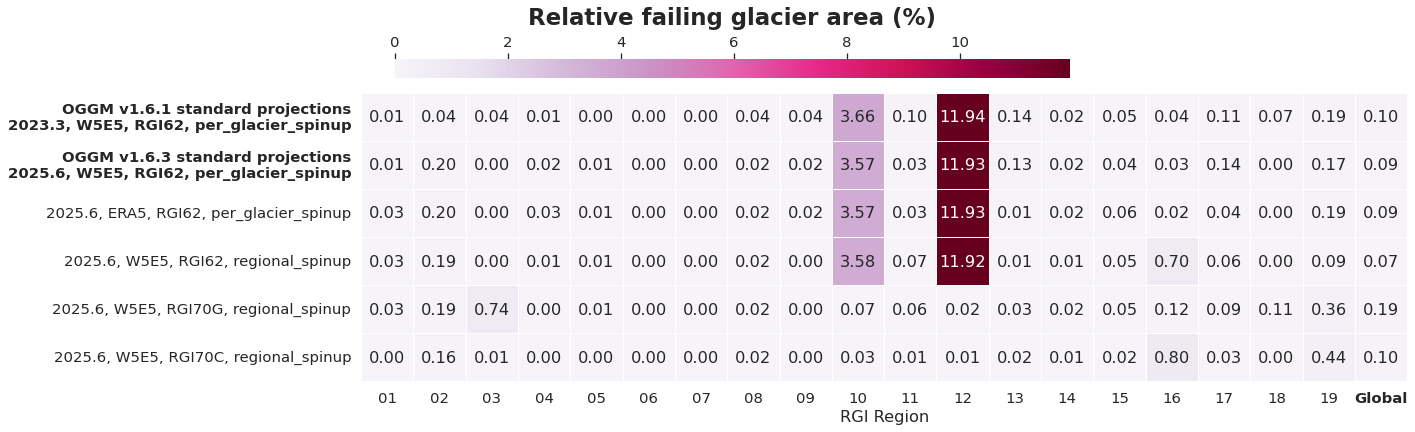
Fig. 1: Failing glacier area (% of RGI area) for each region and globally for different preprocessed OGGM v1.6 glacier directories. The same figure for the number of failing glaciers is available here. Here is the notebook used to create the figure and additional analyses.
“Failing glacier area” refers to the total area of glaciers for which the OGGM preprocessing workflow cannot be completed and which are therefore excluded from the projections. For all analysed preprocessed glacier directories, the glacier area that fails at any point in the OGGM preprocessing workflow is globally below 0.2%. Less than 1% of the glacier area fails in all regions except North Asia (10) and Caucasus and Middle East (12).
- The failing glacier area is slightly reduced for the OGGM v1.6.3 standard projections compared to OGGM v1.6.1, likely due to the use of newer topographical maps in the Subantarctic and Antarctic Islands (19).
- Using ERA5 instead of W5E5 results in a similar failing glacier area.
- Calibrating glaciers at the regional level instead of per glacier slightly reduces the failing glacier area globally, but increases the failing glacier area in the Low Latitudes (16) to 0.7%.
- Using RGI70G or RGI70C instead of RGI62 (all calibrated at the regional level) drastically reduces the failing glacier area in North Asia (10) and the Caucasus and Middle East (12), from almost 4 % and 12 % to less than 0.1 %, because of replaced outlines in RGI 7.0 (see 1, 2). However, in Arctic Canada North (03; only for RGI70G) and in the Subantarctic and Antarctic Islands (19; for both RGI70G and RGI70C), slightly more glacier area fails compared to RGI62. Why the latter occurs is unclear and should be investigated.
- Although RGI70G results globally in around 2.5 times more failing glacier area than RGI62, the failing area remains negligible on the global scale (<0.2%). The much higher quality of RGI 7.0 and the substantial reduction of errors in some regions outweigh this slight failing glacier area increase.
Calibration performance
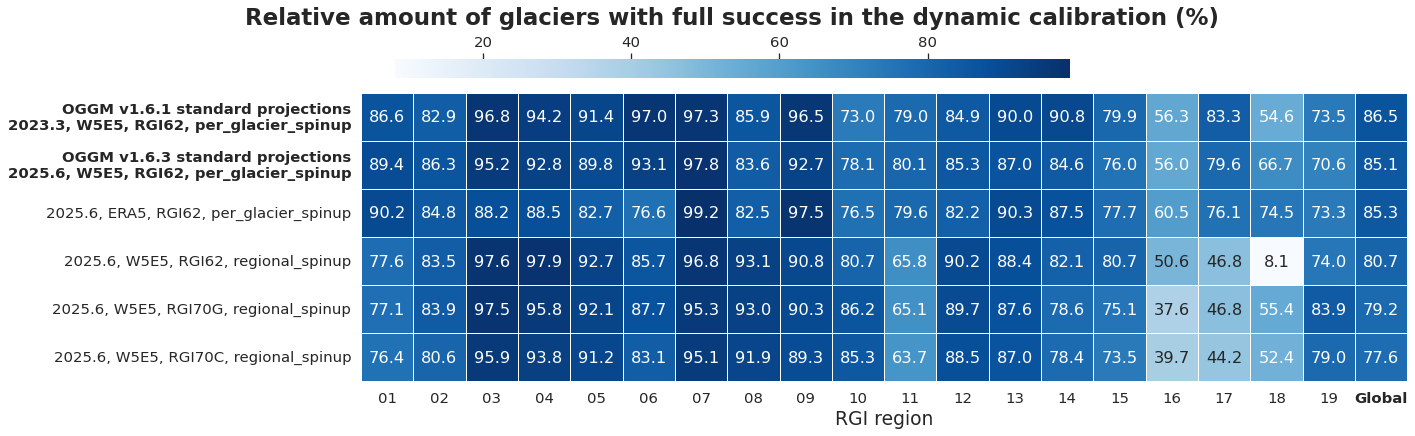
Fig. 2: Percentage of glaciers reaching “full success” in the dynamical spinup calibration. Here is the notebook that created the figure and includes additional analysis.
All preprocessed glacier directories apply the dynamical spinup, which ensures that OGGM matches the glacier area at the RGI date and the glacier mass balance during the 2000–2020 simulation, taking elevation feedbacks into account. If a glacier reaches “full success” in the dynamical calibration, this means that a melt factor can be found that matches during the dynamic historical projection the observed geodetic mass balance within 20% of the error estimate provided by Hugonnet et al. (2021), while matching at the same time the glacier area at RGI date.
- The “full success” performance varies strongly between regions and between preprocessed glacier directories (ranging from 8 to 99% of glaciers). When calibrating each glacier individually, around 85% of glaciers globally reach full success.
- When applying the calibration at the regional level, around 5% fewer glaciers succeed globally (with around 10% fewer glaciers succeeding in five regions, but also three regions showing around 5% higher success rates). The much poorer success of the regional calibration specifically in New Zealand (18) may be related to the many small glaciers in that region, which have a much less negative geodetic mass balance than the regional mean (see Zekollari et al. (2024), Fig. 1).
- Using RGI70G instead of RGI62 does not lead to important differences globally. However, using RGI70G improves the success rate by almost 40% in New Zealand (18; likely due to updating outlines from 1978/1988 to roughly 2000) and by around 10% in the Subantarctic and Antarctic Islands (19), while it reduces the success rate by about 13% in the Low Latitudes (16).
In most regions, we find a relatively good match of the modelled regional mass change in absolute numbers (Fig. 3). If the dynamical spinup and the match to Hugonnet et al. (2021) were perfect, we would expect the modelled regional 2000–2020 mass change to correspond exactly to the geodetic estimates from Hugonnet et al. (2021). However, the dynamical spinup can fail, and even for successful glaciers the per-glacier mass balance is allowed to deviate within 20% of the reported error range.

Fig. 3: Total mass loss by RGI region after the dynamical run.
The largest discrepancies in absolute 20-year mass change occur in the Subantarctic and Antarctic Islands (19), where the regional mass loss obtained using RGI62 is around 50% higher than the observations from Hugonnet et al. (2021) that were used for the calibration. Other glacier models (GloGEM, PyGEM) show a similarly strong or even larger mismatch in this region. This strong mismatch is no longer visible when using RGI70 with OGGM. One possible explanation is the lower dynamical calibration success rate for RGI62 compared to RGI70, although in other regions different success rates do not necessarily lead to different modelled regional glacier mass losses. Another explanation could be the large inventory year differences, which are particularly pronounced for Subantarctic and Antarctic Islands (19) (glacier area-weighted median year is 1986 for RGI62, and 1997 for RGI70G, see also the different historical volume evolution).
When comparing regionally dynamically modelled and observed mass balance (link to figure), larger discrepancies are also visible in the Low Latitudes (16) and in New Zealand (18). Some systematic differences between per-glacier and regionally calibrated gdirs are apparent in the modelled regional mass balance. These may be explained by differences in how the initial area is treated and how glacier area evolves over time. The “regional_spinup” gdirs are calibrated using region-specific mass-balance values from Hugonnet et al. (2021), which differ in some regions from the glacier-area-weighted average of the per-glacier values. This is because the per-glacier geodetic mass-balance observations are defined using a constant RGI area, while the regional values vary over time. Another potential explanation for some differences is that OGGM filters out per-glacier geodetic mass-balance values with very large uncertainties, and uses for these glaciers (and for those with no measurements), the regional mass-balance estimate (link to OGGM doc).
When considering only the fixed-geometry mass balance (link to figure), it becomes clear that the “regional_spinup” gdirs are calibrated towards the sometimes more negative regionally estimated mass-balance values compared to the “per_glacier_spinup” gdirs, which are calibrated using individual glacier observations. However, the absolute regional mass-change estimates are almost identical when using regional instead of per-glacier calibration (<1% difference in all regions except New Zealand (18), where the difference is around 2%), suggesting that integrated historical mass change may be a more robust metric to consider.
Global and regional glacier volume projection differences
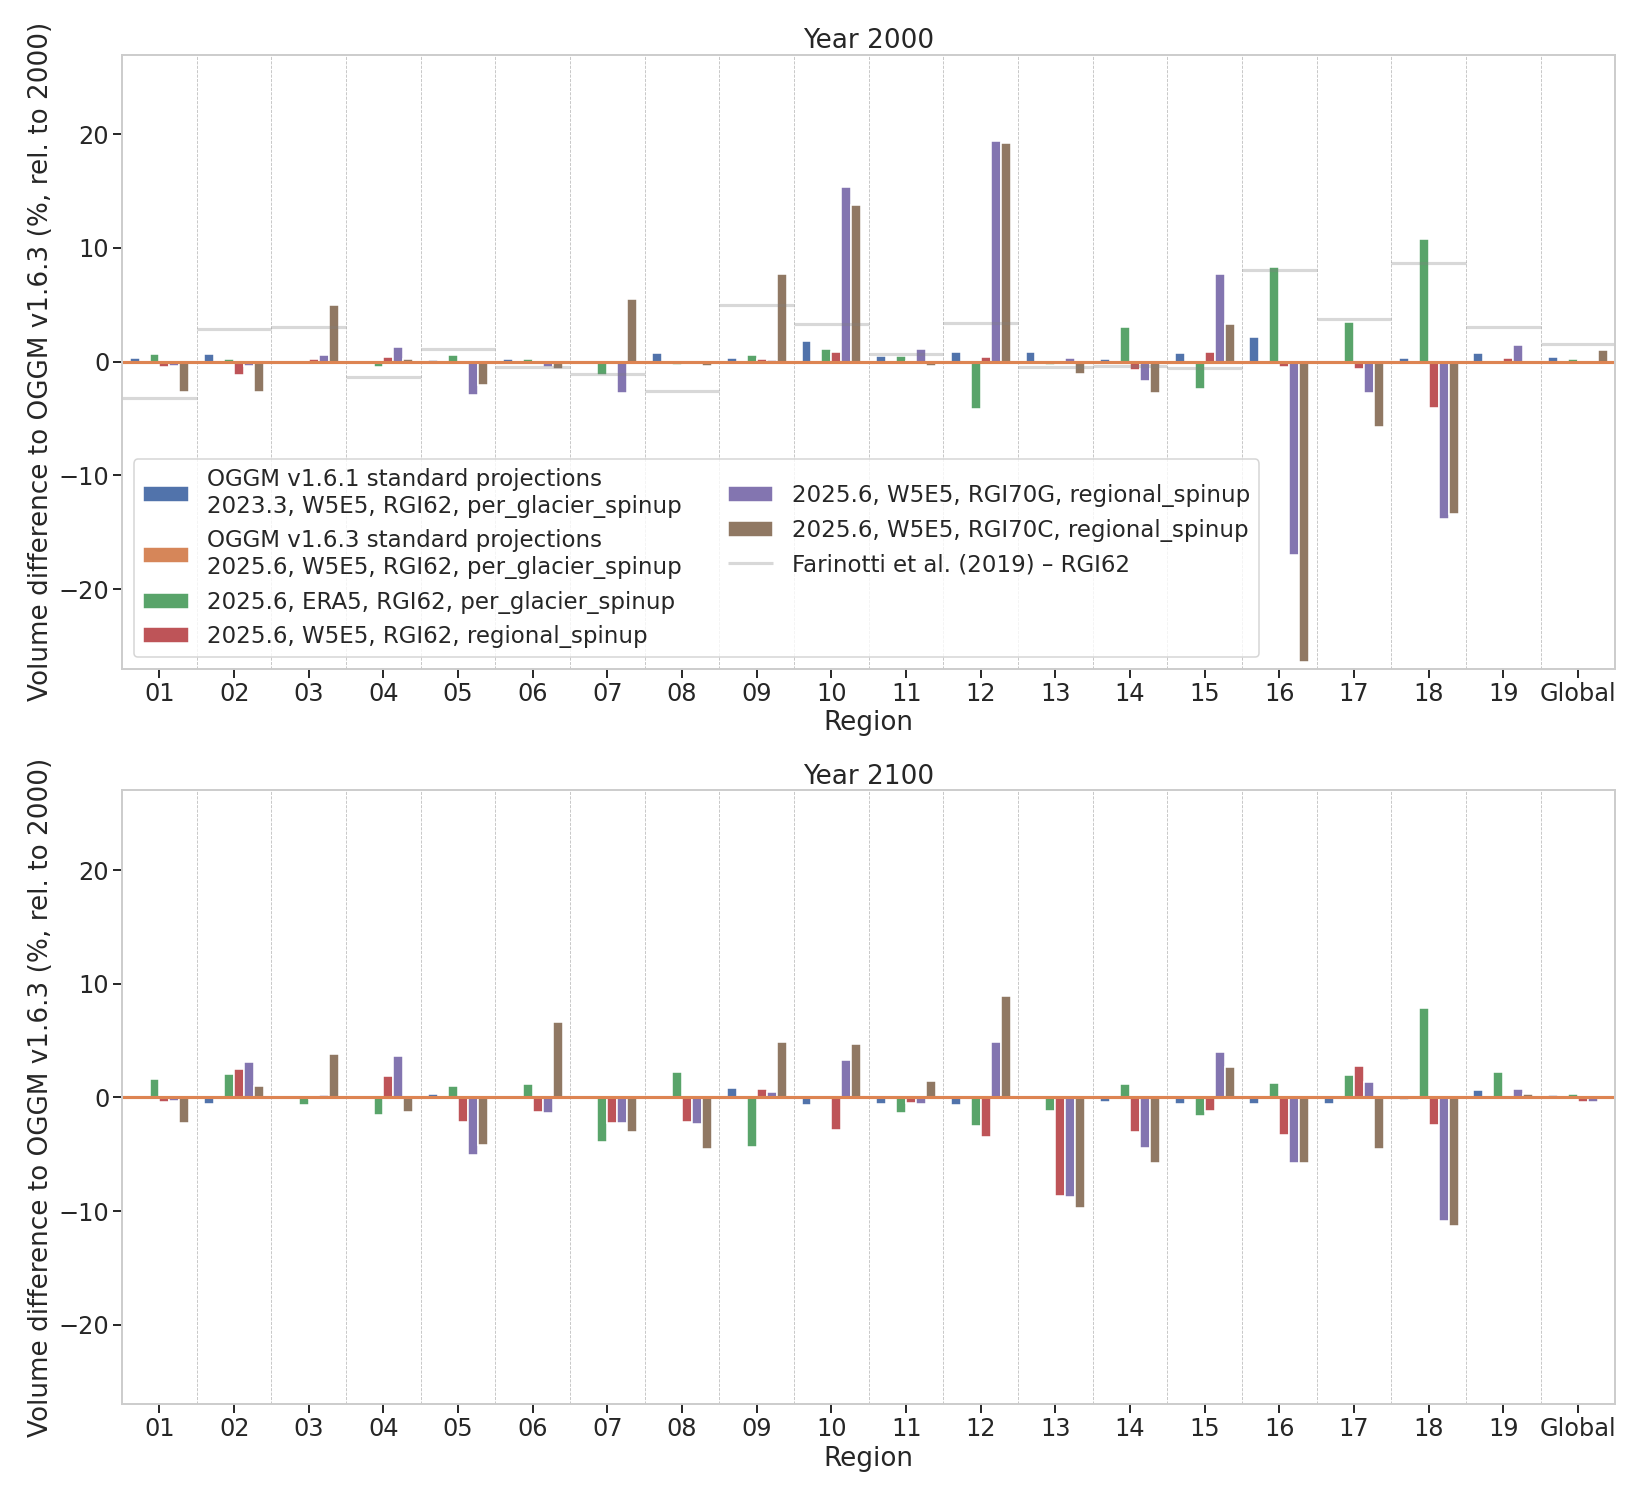
Fig. 4: Glacier projection differences in 2000 and 2100 relative to the OGGM v1.6.3 Standard Projections for different OGGM v1.6 preprocessed glacier directories. Numbers are given in % relative to the 2000 OGGM v1.6.3 Standard Projections. We used only one climate model (MRI-ESM2-M) and one scenario (SSP1-2.6) for the comparison and aggregated all glaciers, even though some options contain more failing glaciers than others. Restricting the analysis to “commonly running glaciers” leads to negligible differences (<0.5% in all regions except the Low Latitudes (16), with ~1% differences) For comparison, we also include the Farinotti et al. (2019) community volume estimate, which is valid at the RGI62 inventory date. Link to figure with volume projections from 2000 to 2100, including GloGEM and PyGEM. Link to notebook used for the analysis.
Globally, glacier volume projection differences between the options are negligible. Differences are up to 1% in 2000 (RGI70C vs OGGM v1.6.3), decreasing to <0.1% in 2100 under SSP1-2.6 (or remaining at roughly 1% for higher-emission scenarios). Regionally, some differences are visible, but these are much smaller than the differences to GloGEM and PyGEM (see comparison figure).
Although OGGM RGI62 gdirs were calibrated to match regional Farinotti et al. (2019) volumes at the inventory date, year 2000 glacier volumes from OGGM using RGI62 may differ from this estimate for several reasons:
- The Farinotti et al. (2019) estimate is valid at the RGI62 inventory date, which differs substantially from the year 2000 in some regions. How the volume changes from that year to 2000 is different for each option, which also explains the 2000 volume differences between the options.
- While regional OGGM inversion volumes should match the Farinotti et al. (2019) community estimate by calibration, North Asia (10) and Caucasus and Middle East (12) contain a considerable amount of failing glacier area, which explains why the inversion volume of these two regions is around 6% smaller than the community estimate (link to figure).
Let’s now compare the projections for each option individually:
- Differences between the OGGM v1.6.1 and v1.6.3 Standard Projections remain within 2% over the entire projection period in all regions; globally, differences are <0.5%. At the beginning of the projections (year 2000), the OGGM v1.6.3 Standard Projection preprocessed glacier directory is within ±8% of the Farinotti et al. (2019) community estimate in all regions.
- Using ERA5 instead of W5E5 leads to differences of 4–11% relative to the OGGM v1.6.3 Standard Projections in 2000 for the Caucasus and Middle East (12), Low Latitudes (16), and New Zealand (18). In New Zealand (18) and in the Russian Arctic (09) estimated absolute projection differences in 2100 are above 4%. Differences in regional climate evolution between the RGI date and the inversion date may explain part of the initial volume discrepancies. However, OGGM–ERA5 projections are not substantially closer to GloGEM and PyGEM, which have also used ERA5. Other differences, such as model physics, calibration and initial volumes may hide the influence of the baseline climate choice.
- The regional calibration does not create large projection differences globally and for most regions, as per-glacier differences are compensated at the regional scale (see e.g. Zekollari et al. (2024). However, regional calibration creates an around 4% lower 2000 glacier volume in New Zealand (18) with diminishing differences until 2100. In addition, glacier volume projections in Central Asia (13) are around 9% lower in 2100 with the regional calibration (similar tendency found for this region in Zekollari et al., 2024 (Fig. 4)). With the largest number of glaciers, this region is more strongly affected by regional calibration than smaller regions.
- Because the same regionally calibrated “Glen A” parameters derived from RGI62 were applied to RGI70G, any inversion volume differences between the RGI versions arise solely from updated glacier outlines and inventory years, not from changes in data or methods. This results in inversion volumes that are over 10% larger in North Asia (10) and the Caucasus and Middle East (12) (partly because RGI7 contains much less failing glacier area), and over 15% smaller in the Low Latitudes (16) and New Zealand (18) (link to figure). Inversion volumes are valid at different years for RGI62 and RGI70, so differences between the preprocessed gdirs can be even larger in 2000 than at inversion (Fig. 4). Over time, projection differences decrease in regions with the largest initial discrepancies. Some remaining differences in 2100 are due to the regional calibration, as both RGI62 and RGI70 gdirs with regional calibration produce similar 2100 projections in several regions.
- Using glacier complexes (RGI70C) instead of individual glaciers (RGI70G) leads to substantial volume differences (>4%) in four regions in 2000 and to a ~1% larger global volume. By 2100, estimated absolute volume differences decrease globally and in these four regions, but appear instead in two other regions.
Discussion
- Which preprocessed glacier directory should you use?
- In many cases, the preprocessed glacier directory from the OGGM v1.6.3 Standard Projections (gdir link) is a good choice. Using ERA5 has the advantage that climate data goes until 2025, which is very useful for some applications. In some regions, ERA5-calibrated glacier directories are quite different, calling for more investigation. The regional calibration glacier directories are experimental and were mainly created for comparison with RGI70, where per-glacier observational data are not yet available.
- Should you already use the RGI70G preprocessed glacier directors (gdir)?
- The currently available RGI70G preprocessed gdirs are only calibrated regionally by assuming that the RGI70 mass-balance is regionaly similar to RGI62. Thus, we recommend to wait until per-glacier calibrated gdirs are available (latest until April 2026). We expect to see some differences when using geodetic observations directly estimated from the RGI70 outlines.
- What does this mean for GlacierMIP4?
- Assuming RGI62 to be valid in the year 2000 leads to substantially different 2000 glacier volumes compared to current OGGM projection estimates with spinup. RGI70G is closer to the year 2000 (for regions 10, 18, and 19), which reduces these differences under such an assumption (as planned for GlacierMIP4). However, when comparing glacier volume projections between RGI62 and RGI70G, it is necessary to clarify the sources of these differences: whether they arise from the updated glacier outlines themselves, from the different valid inventory years, or from inventory-specific initialization assumptions that may perform better for one dataset than for the other.
- Historical mass changes from 2000 to 2020 can differ between glacier models (and options), even though they were all “calibrated” to the same geodetic mass-balance estimates.
- Some of the projection differences between preprocessed glacier directories within OGGM may help interpret later differences in GlacierMIP4 projections.